Using Northbeams
Track LLM usage and spend
Last updated 2026-07-13
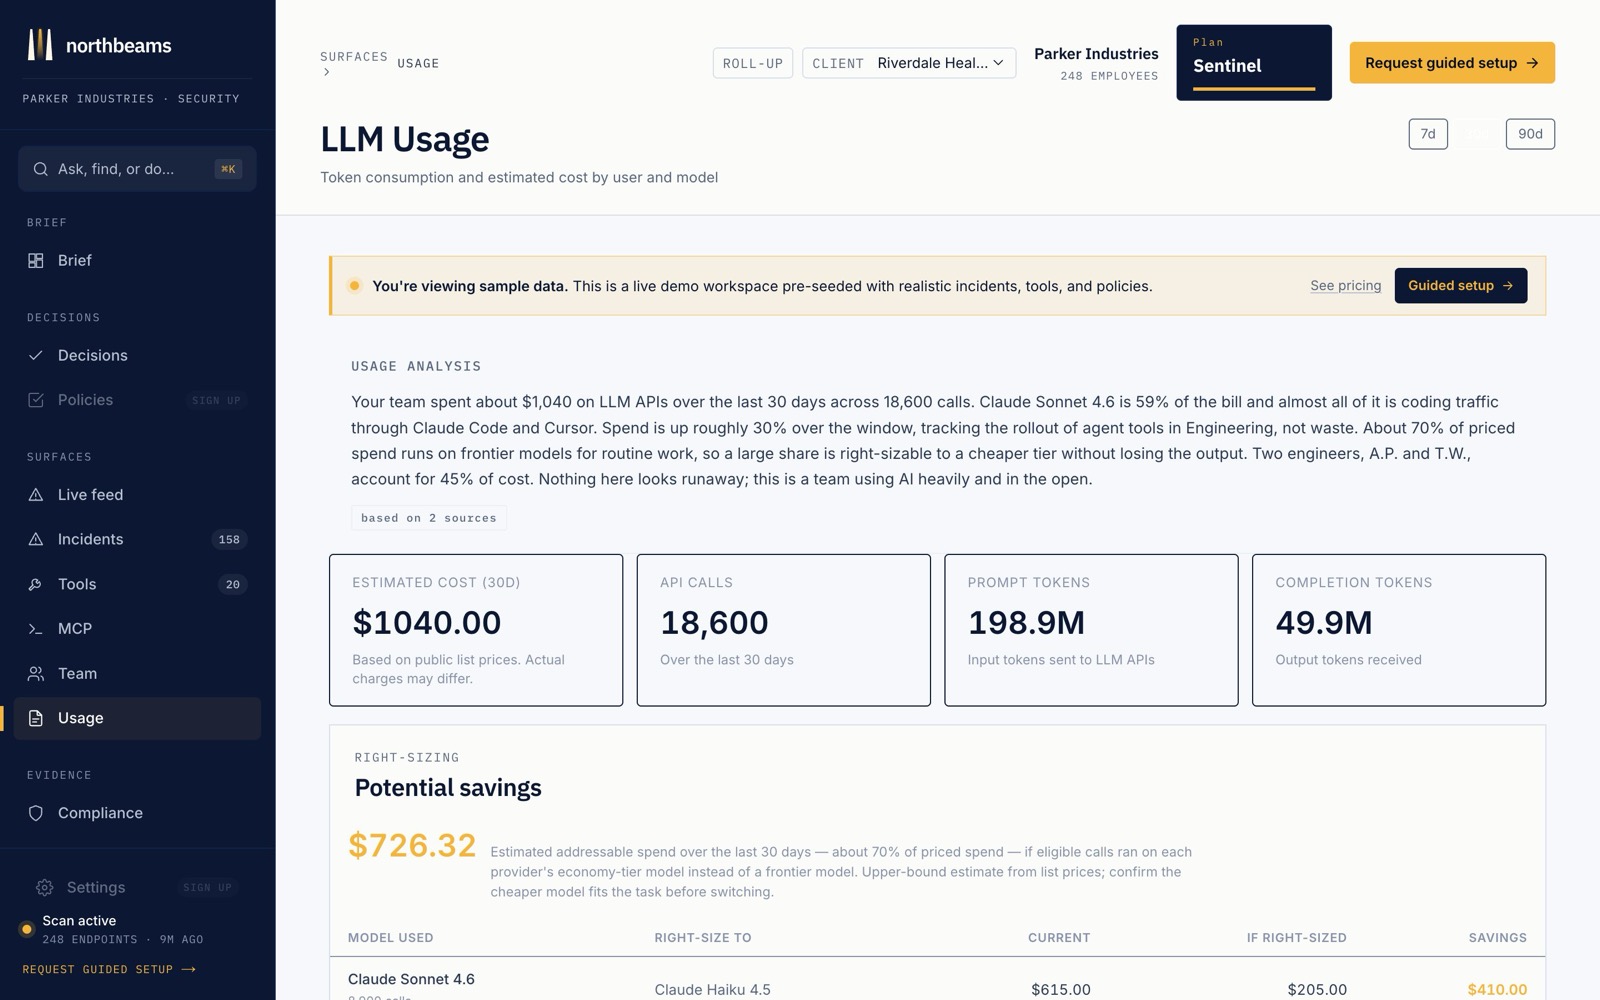
Open Team, then Usage for LLM Usage: token consumption and estimated cost by user and model, so you can see where your AI spend actually goes.
What it answers
- What are we spending? Estimated cost, API calls, and prompt and completion tokens over your chosen window, based on public list prices.
- Which models dominate the bill? The models driving cost, so you know where to focus.
- Who is driving it? Cost by user, so a spike ties back to a real person and a real project, not a mystery line item.
Right-sizing
A Potential savings panel estimates how much of your spend runs on frontier models for routine work, and what you would save by moving eligible calls to each provider's economy tier. It is an upper-bound estimate from list prices, so confirm the cheaper model fits the task before you switch, but it is the fastest way to spot spend that is easy to reclaim.
Pick a 7-, 30-, or 90-day window at the top right. To estimate the dollar cost of your whole AI stack before you deploy, pair this with the free AI Spend Scanner.